 After a gargantuan crash like the one 2 weeks ago, you generally don't expect to go back up within a month. Your choice is either consolidation or worse. So far we're consolidating, and that's good. No important levels broken.
So this weekend, I decided to take the opportunity to look at monthly charts in gold and silver, going back all the way to when gold was under $300 and silver under $5.
Starting with gold, it's truly amazing how narrow the decade-long channel is... just +/- 15% from the center trend line. There has been only one month that closed out of the channel (October 2008).
 Note that whenever the top blue trend line has been hit (4 times since 2003), there has generally been a long correction back down to the lower blue trend line. Presently, the lower trend line is at $1400. An overshoot (in a 2008-type scenario) would take us down to the 2 or 3 year moving average, perhaps as low as $1200. Thus, while gold's fundamentals are as strong as ever (both as a safe haven without counter-party risk and as a defense against diminishing purchasing power), "technically" it's highly ambiguous right now whether we're going up or down (and technicals do matter in the short term, often more than fundamentals).
Since gold and silver travel together, maybe the silver charts can make up for some of gold's ambiguity at this point. On the long term monthly silver chart, the trend channel is +/- 23% from the center trend line.
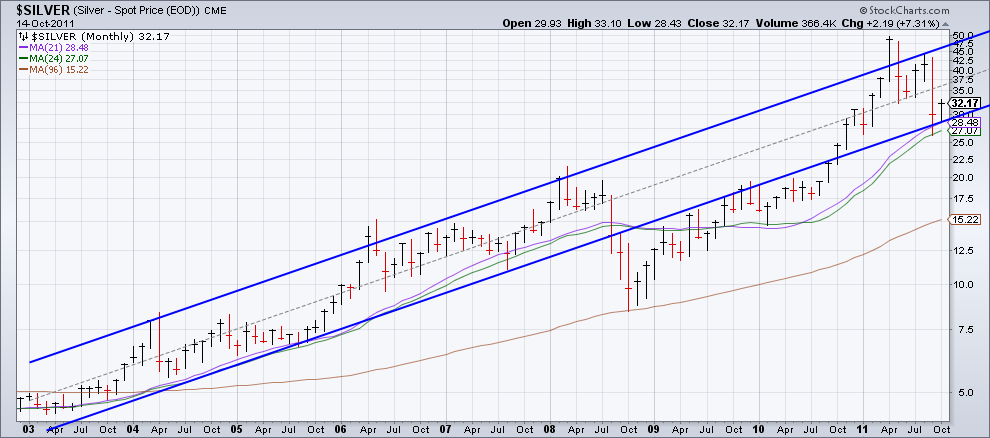 What's quite encouraging about this chart is that the 2-year moving average (green) was support in September, and the 21-month moving average (purple) has been support 2 weeks into October. Importantly, the 21-month moving average has just entered the trend channel, and the 24-month is not far behind. Thus, it will probably take a major external shock to push silver emphatically out of the channel now (i.e. as happened in 2008). In other words, it will take some doing to push silver below $28.50, with $27.50 now secondary support -- and the COT seems to indicate that's unlikely.
But if such an external shock occurs (say some news the market regards as profoundly deflationary) ... watch out. Note how in 2008, silver fell all the way to its 8 year moving average (!).
But, buyers of physical silver should also note that even with such a precipitous drop, the secular bull was not over. The equivalent today would be a fall to $15-16. You have to wonder how people can call silver a bubble when it rather quickly recovered from the 2008 bloodbath. Fundamentals certainly haven't gotten worse since then.
Moreover, check out this chart:

Yes, that's the same silver chart when September 2008 is switched with October 2010. In other words, there's no net difference in price; simply imagine if, instead of crashing in September 2008, silver had gone up by October 2010's amount, saving the crash for October 2010. Remarkable, is it not? Had the rise preceded the fall, the monthly silver channel would be even more dependable than gold's.
2 comments:
GM you do a great job. Thank You!!!
Thanks GM. Very interesting. The last one is weird.
Post a Comment